- Acne
- Actinic Keratosis
- Aesthetics
- Alopecia
- Atopic Dermatitis
- Buy-and-Bill
- COVID-19
- Case-Based Roundtable
- Chronic Hand Eczema
- Chronic Spontaneous Urticaria
- Drug Watch
- Eczema
- General Dermatology
- Hidradenitis Suppurativa
- Melasma
- NP and PA
- Pediatric Dermatology
- Pigmentary Disorders
- Practice Management
- Precision Medicine and Biologics
- Prurigo Nodularis
- Psoriasis
- Psoriatic Arthritis
- Rare Disease
- Rosacea
- Skin Cancer
- Vitiligo
- Wound Care
News
Article
LC-OCT Demonstrates Non-Invasive Evaluation Capabilities of Dermal Fillers
Author(s):
At T0, skin layers appeared normal, and at T1, filler deposits were clearly visible as hyporeflective areas.
Line-field optical coherence tomography (LC-OCT) may be a useful tool in non-invasively evaluating the capabilities of hyaluronic acid dermal fillers, according to a study published in Skin Research and Technology.1
When assessing dermal fillers utilizing LC-OCT, researchers were able to observe distinct characteristics and visualizations immediately after injection and at a later follow-up date.
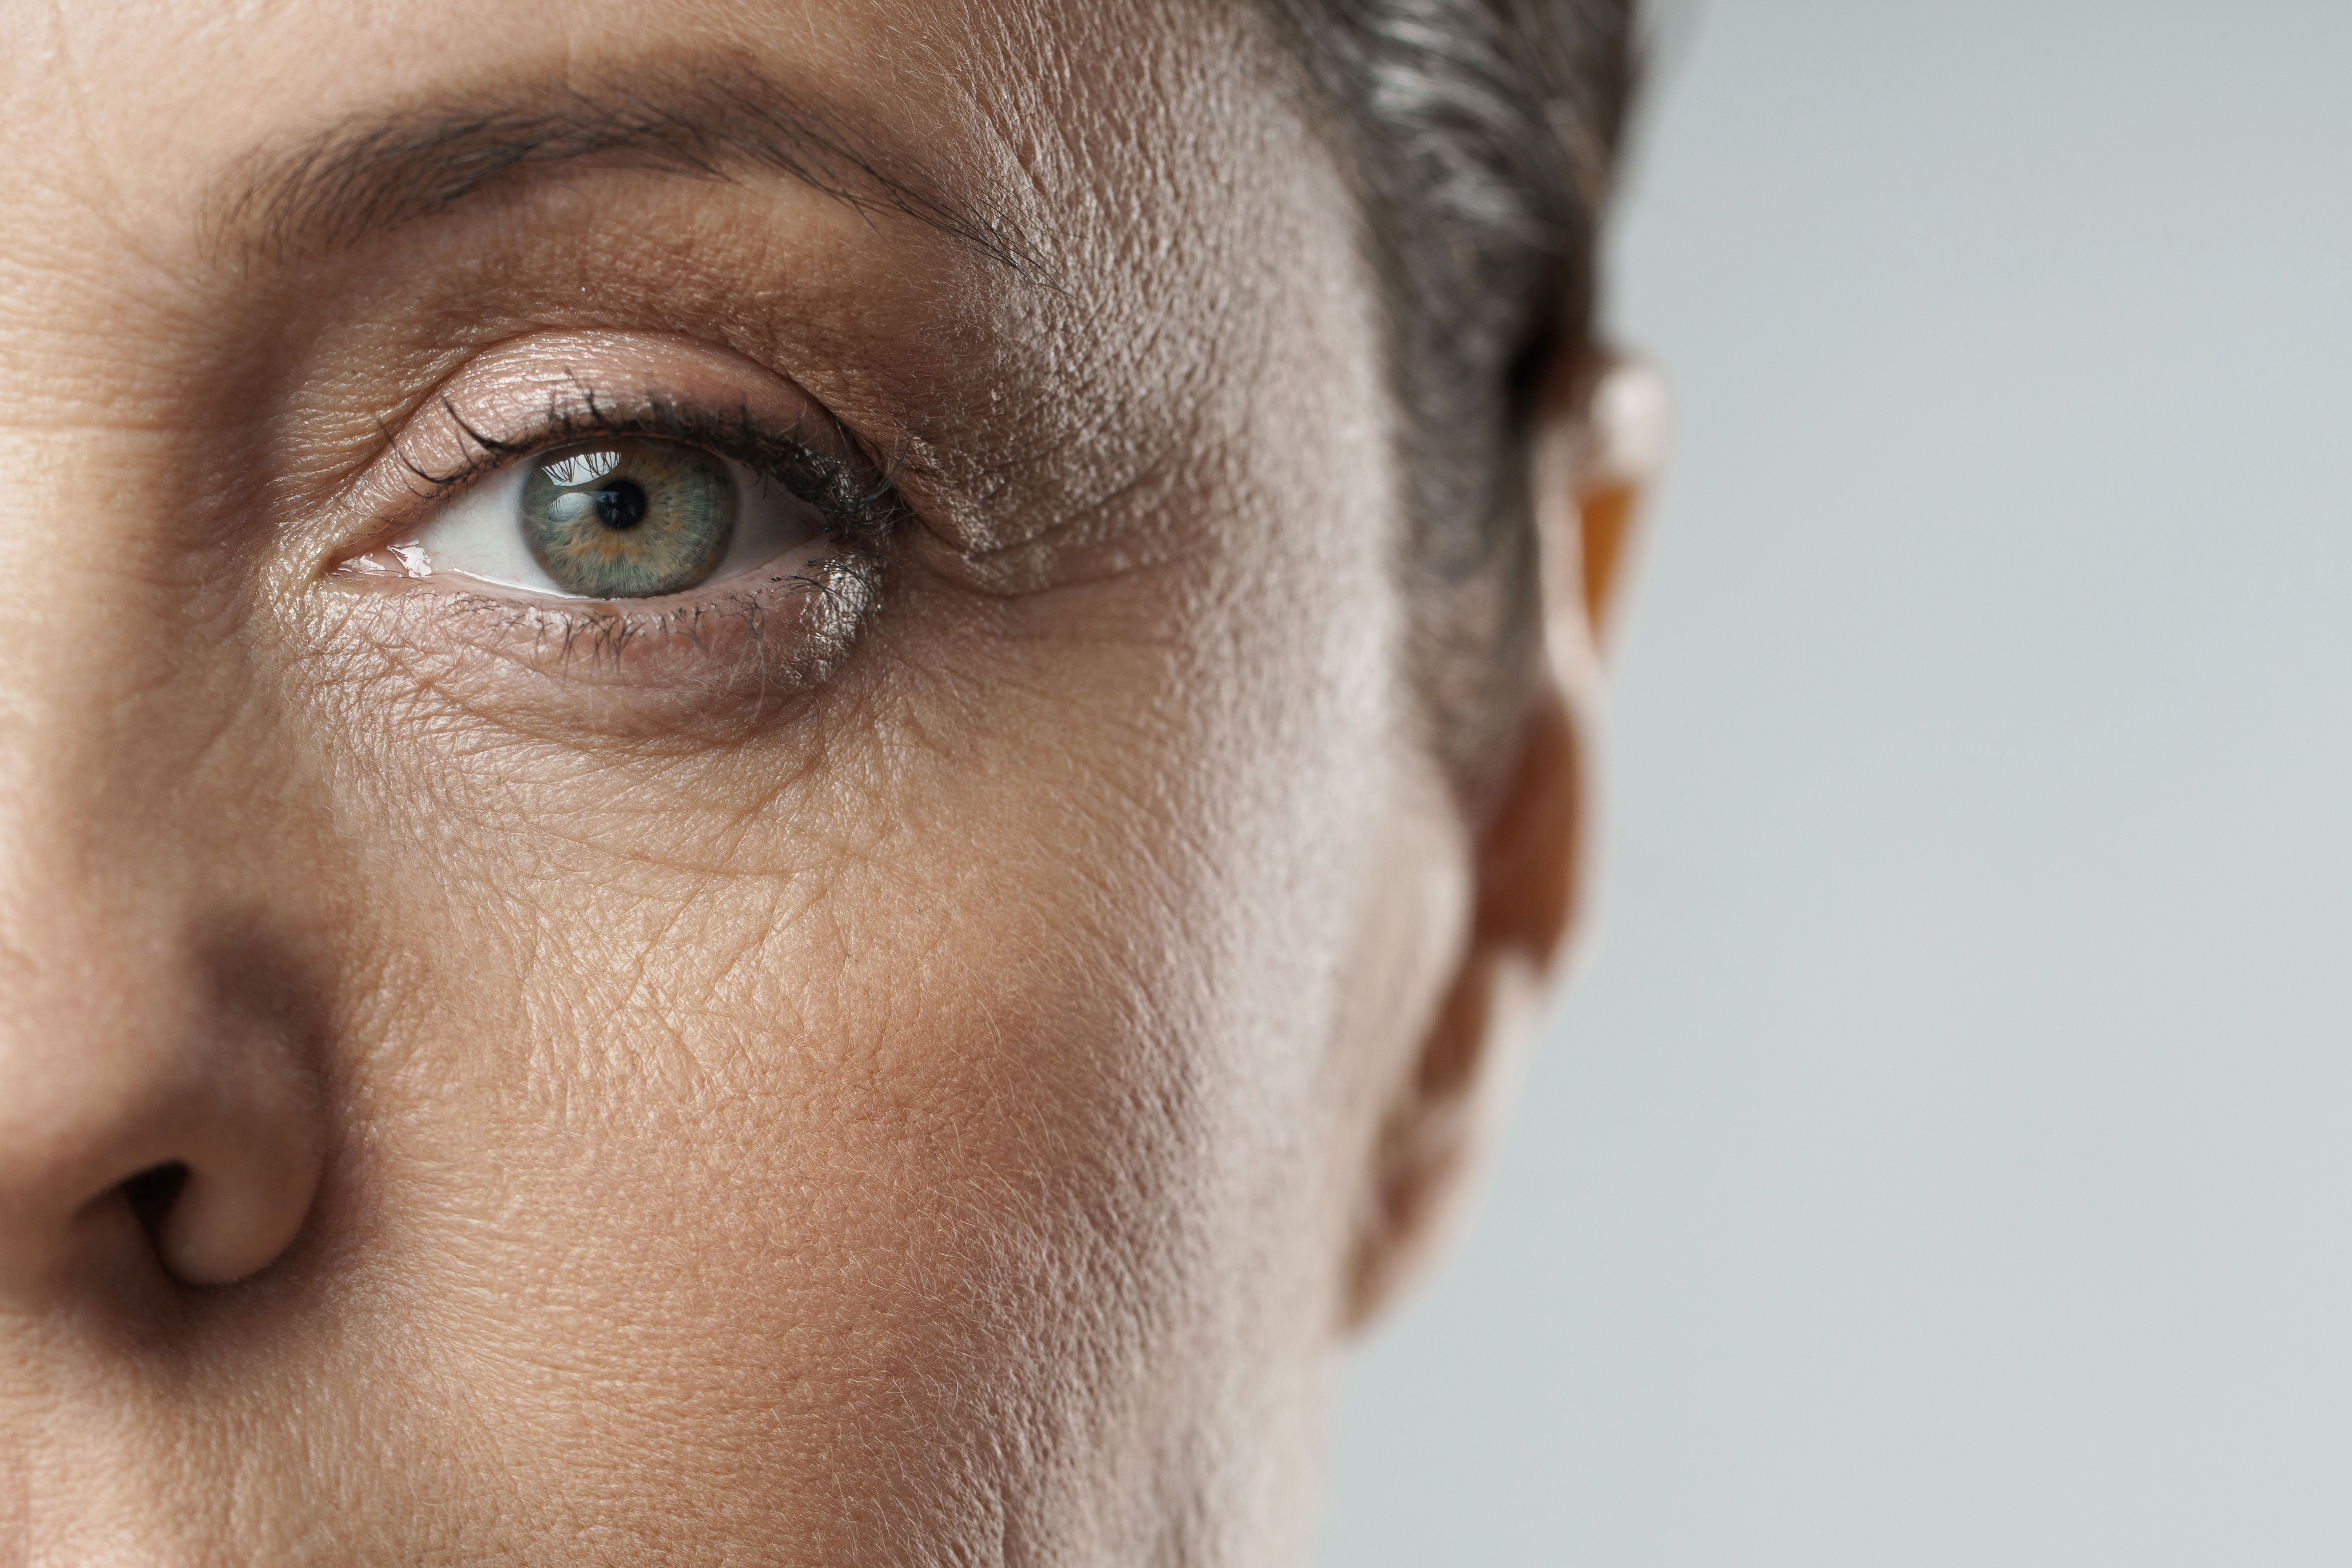
Image Credit: © Iryna - stock.adobe.com

Background and Methods
Researchers behind the present study identified several recent investigations of non-invasive evaluation methods for fillers, such as assessment with high-frequency ultrasound and magnetic resonance, for example. A 2018 study published in the same scientific publication outlined the capability of high-frequency ultrasound to distinguish between granulomas, nodules, and dermal filler deposits.2
In order to assess the efficacy of LC-OCT in applications related to dermal fillers, 6 patients received injectable facial hyaluronic acid fillers and underwent LC-OCT imaging at 3 stages: before, immediately after, and 6-8 weeks post-injection. A dermatopathologist assessed clinical images to identify morphological or reflectivity changes.
Findings
Patients included in the study ranged in age between 30 to 59 years. Each patient received dermal filler treatments in various facial locations.
At the initial assessment (T0), conducted before the application of dermal fillers, LC-OCT scans revealed the normal characteristics of the skin. The epidermis was clearly distinguishable from the dermis, and vascular structures were visible within the dermis. Notably, researchers observed that the epidermis at the lip area was thicker compared to other sites, such as the tear trough and nasolabial folds.
Scans taken at T1 — immediately after the procedure — showed the fillers as homogenous, hyporeflective areas within the dermis. These areas were clearly differentiated from the surrounding tissues, including blood vessels and other dermal structures. The imaging demonstrated that the filler deposits were distinct and well-defined, with 1 observed deposit measuring approximately 188 micrometers in diameter.
At the 6-8 week follow-up visit (T2), LC-OCT imaging illustrated a reduction in the size of the filler deposits compared to their size immediately after application. The filler appeared as smaller hyporeflective areas within the dermis. Additionally, researchers observed significant changes in the dermal collagen fibers. By T2, these fibers had become thicker and more uniformly organized, displaying increased hyperreflectivity.
When comparing the LC-OCT images from T0 and T2, researchers observed notable improvements in dermal collagen. At T2, collagen bundles were thicker and more regularly organized, showing greater hyperreflectivity than at baseline. This suggests that the skin undergoes positive structural changes following filler application, possibly due to the natural remodeling processes and the fillers’ interaction with the dermal tissue.
Immediate and follow-up imaging provided researchers with insights into the spatial distribution of fillers and the subsequent changes in skin structure. These observations can guide practitioners in predicting filler behavior over time and in making informed decisions about treatment strategies.
Conclusions
Researchers did not identify any potential limitations of the study but made note of its usefulness in establishing a clear capability of LCT-OCT in this use.
"Overall, we were able to establish the usefulness of LC-OCT in the non-invasive evaluation of dermal HA fillers to visualize both short-term and medium-term effects," according to Musolff et al.
Study authors recommended further research to establish a more comprehensive understanding of LC-OCT's potential and utility in both clinical and cosmetic applications.
References
- Musolff N, Sanabria B, Caetano V, Pulgarin L, Chaudhry ZS, Rao B. LC-OCT as a tool to visualize in vivo location of dermal fillers. Skin Res Technol. August 21, 2024. https://doi.org/10.1111/srt.70014
- Mlosek RK, Skrzypek E, Skrzypek DM, Malinowska S. High-frequency ultrasound-based differentiation between nodular dermal filler deposits and foreign body granulomas. Skin Res Technol. 2018; 24(3): 417-422. doi:10.1111/srt.12444
Newsletter
Like what you’re reading? Subscribe to Dermatology Times for weekly updates on therapies, innovations, and real-world practice tips.


